Data is beautiful.
Energy.
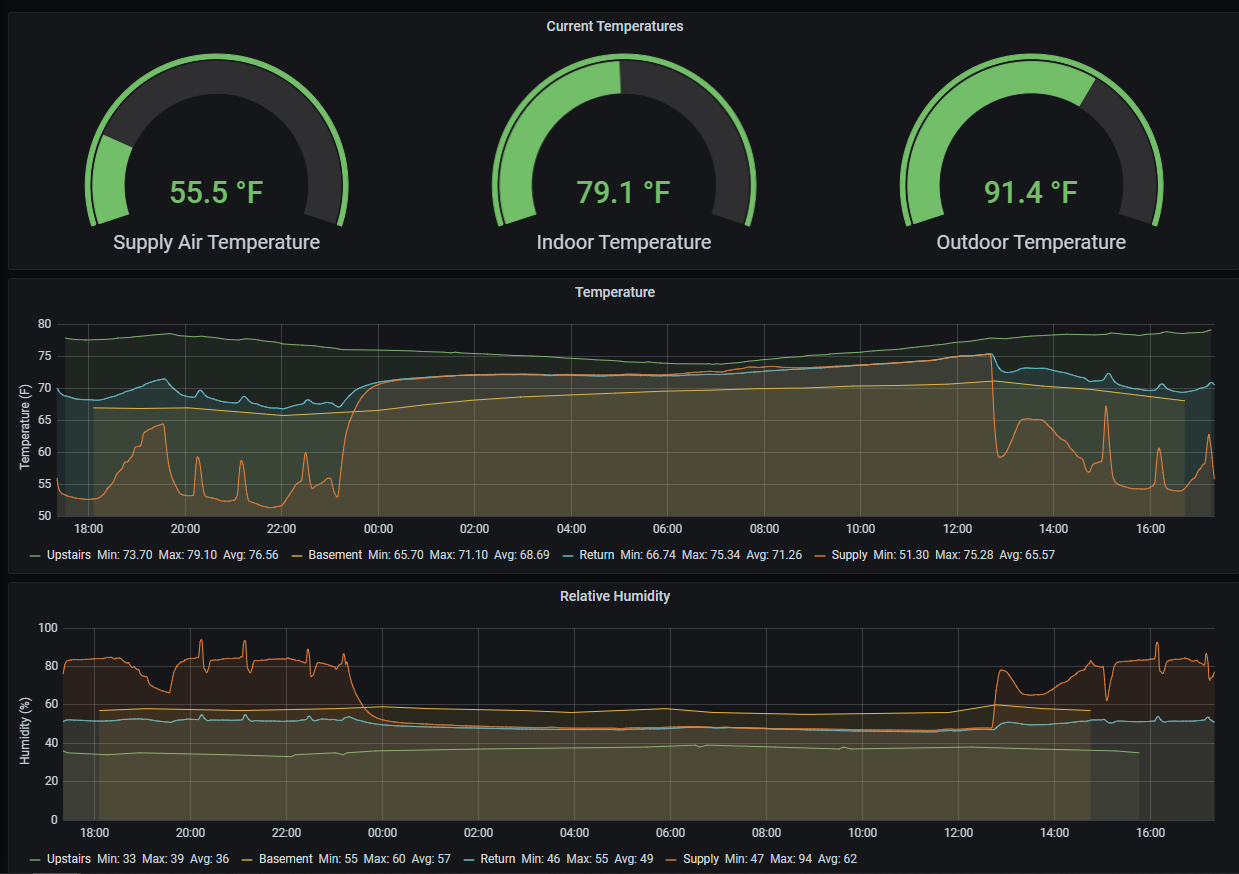
Adam has installed a host of both out of the box and home built energy monitoring equipment in order to both identify failed/failing equipment and better inform where opportunities for improvement are. The dashboard to the left shows a sample of the data from that equipment brought into a single place.
Stratification.
Utilizing ten temperature probes equally spaced apart up the side of a wall and addressable RGB LEDs, Adam was able to create a real-time visualization of stratification. This also included a historical visualization component that allows for an interesting perspective otherwise invisible to the naked eye.
Climate.
Through a combination of software and hardware integration, Adam has setup temperature and humidity monitoring at various locations in his home. This not only allows him to prove out equipment performance but also see the impacts of thermal barrier changes he makes. The payback of an incremental increase in wall insulation vs. attic insulation can finally be answered!


